Greater Philadelphia Region Local Tourism Survey 2023
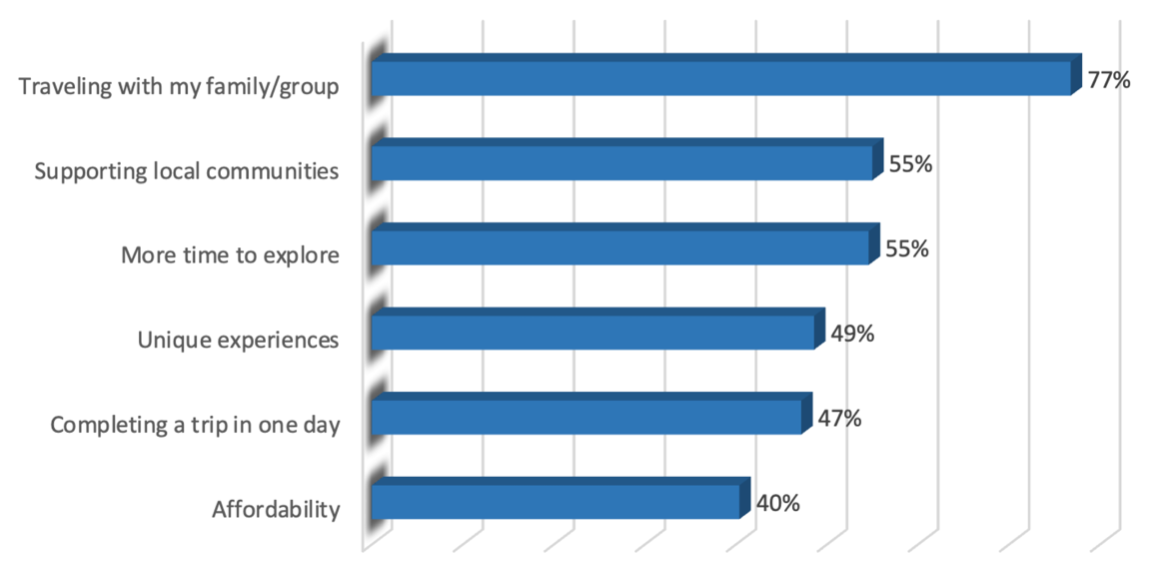
As the world slowly but surely starts to open up again, travel enthusiasts everywhere are itching to get out and explore their own backyard. Whether it’s a day trip to a nearby county or a weekend getaway to a city, the concept of being a “local tourist” has never been more appealing. In fact, according to a recent survey of 500 people living in the Philadelphia region, 77% of people said that “traveling with their family or a group” was the best thing about being a local tourist.1
Those surveyed also value “supporting local communities” and “less time to travel means more time to explore” (55% for each benefit). With the COVID-19 pandemic still affecting travel plans, it’s no surprise that people are opting for local tourism more than ever before. See the graph below for a list of benefits, in priority order, for being a local tourist.

So, where will local travelers visit in the next year? According to the survey, 92% of those surveyed planned on visiting area counties or the city of Philadelphia two or more times in the next 12 months. And of those, 73% plan on staying overnight. This is great news for local businesses and destination marketers in these areas, as it means more tourism dollars will be spent in the community.
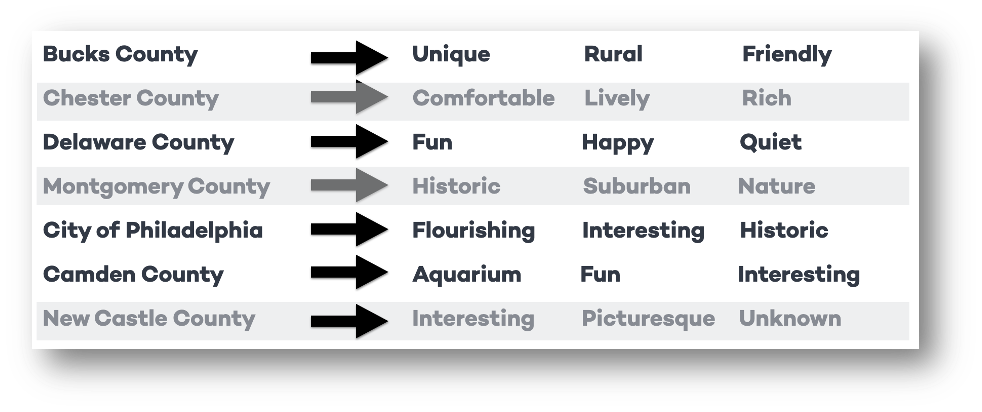
The one-word description of each of the areas provided by survey respondents highlights important marketing opportunities for each specific county. This chart shows the most frequently mentioned words for each county.

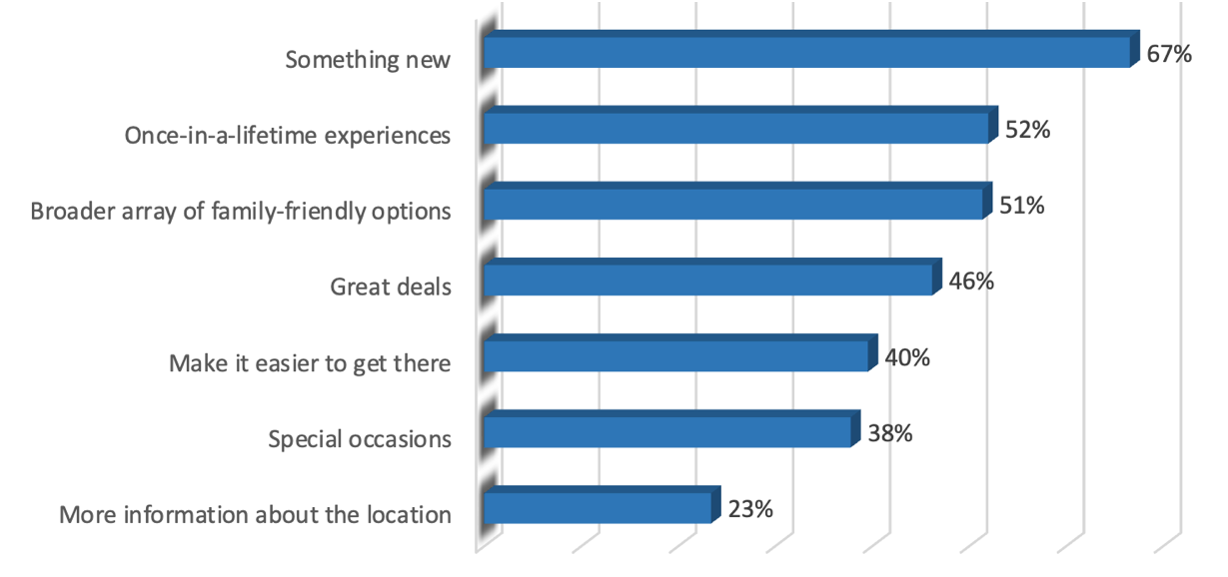
But what would encourage people to visit an area they weren’t planning to go to? According to the survey, more than two-thirds of people said something new would do the trick. This could be anything from a new attraction to a museum to a recreation/sports facility. Additionally, 52% identified a once-in-a-lifetime experience (e.g., a superstar concert, celebrity visit or special celebration) as something that would draw them to an area. However, a once in a lifetime opportunity doesn’t always have to be “big” to drive destination visits. They can be smaller and tailored to individual’s interests such as an interactive art installation, the chance to experience an unusual natural phenomenon, a curated event for foodies, a NASCAR ride, a historic reenactment, or the opportunity to see and experience iconic TV, movie or sports memorabilia (think sitting on the set of Friend’s “Central Perk” Café set or trying on a Superbowl ring) and so on. This graph shows what would encourage people to visit an area they weren’t planning to go to, in priority order.

Finally, we asked how people are finding out about these local and regional places to visit. Almost three-quarters (73%) of those surveyed said it was through travel websites, followed by social media (65%).2 For local businesses and destinations, this underscores the importance of having a strong online presence.
Overall, the survey results show that the local tourist is a significant audience on which to focus marketing efforts. Eager to explore new areas and support local businesses, the local tourist presents a great opportunity for destination marketers to promote regional tourism and showcase the diversity of experiences available within a short driving distance. By offering unique experiences and leveraging online channels to reach potential visitors, destinations can distinguish themselves, tailor their messaging and attract visitors to their local communities.
1 Local tourist is defined as a day trip or overnight stay in the greater Philadelphia five-county region, southern New Jersey or northern Delaware. The online survey used Pollfish to gather responses from residents split evenly among Bucks, Chester, Delaware, Montgomery, Camden and New Castle counties, as well as the city of Philadelphia. Survey population parameters included all genders, ages 25 to 54 and household income of $75,000 or greater. Survey was in the field from March 3 through 20, 2023.
2 Social media platforms and the percentages of responses for each, in order of preference: Facebook (32%), Twitter (25%), YouTube (22%) and Instagram (20%).


